Visual Filters - Sheet Swap with an Image!
- Dawn Harrington
- Sep 3, 2024
- 2 min read
Do you have a client that wants to see data in different chart types in an already visually busy dashboard? If you use the Sheet Swapping technique, you can display one chart and “hide” others. In the below tip I created a legend using images for different chart types. This legend contains images of three different charts, a Bar, a Line and a Map. When the user clicks on the image, the chart in the dashboard will change according to the image they selected!
The inspiration behind this tech tip is from visionary Zak Geis's Tableau Public Customize Chart Design Tip dashboard here.
Example of the Legend with Images

In my example I created three different worksheets with the Sample - Superstore data set.
I created a Bar chart using the Profits by Month and Region

I created a Line/Area chart using Sales by Month

I then created a Map/Shape Chart using Profits and KPI Arrows

I created the below Parameter:

Then on the Bar worksheet, I created the below calculated field and set it to TRUE in the Filters Marks card.

I created a similar calculation for the Line worksheet and placed it on the Filters Marks card as TRUE.

In order to do this, I had to right-click on the Parameter to show it and change it to the Line option.

I then had to create the last calculation for the Map worksheet and repeat the steps above.

Then in a blank Excel worksheet or Google sheets document I created the below document.
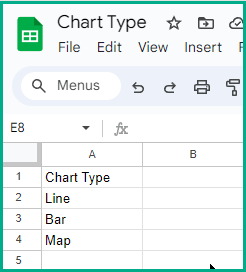
I then connected to this Excel document as a second data source.
On a new worksheet in this same workbook, using this data source I placed Chart Type on the Columns shelf.
I changed the Marks Type to Shape.
I placed Chart Type on the Shape Marks card.
I changed the shapes to what was shown in the legend in the beginning of this blog.
I hid the headers.
I also cleaned up the tool tip below;
Click to select the <Chart Type>
I named this worksheet Legend.
Then on a new dashboard, I added a Vertical container.
I added all of the chart worksheets to this container.
I then hid the Titles of each worksheet.
I added a second vertical container to the dashboard and added a button to it. I then made the container floating.
I placed the Legend worksheet inside this collapsible container.
I added a Text object above the sheet in the collapsible container to contain instructions for future users.
I then added the below Dashboard action;

This enables the charts to change on the dashboard by clicking on the different images.
You can see and download the final dashboard here.
Comments